R Shiny Server
How to build a Dashboard based on R Shiny Server.
Preparing your Code
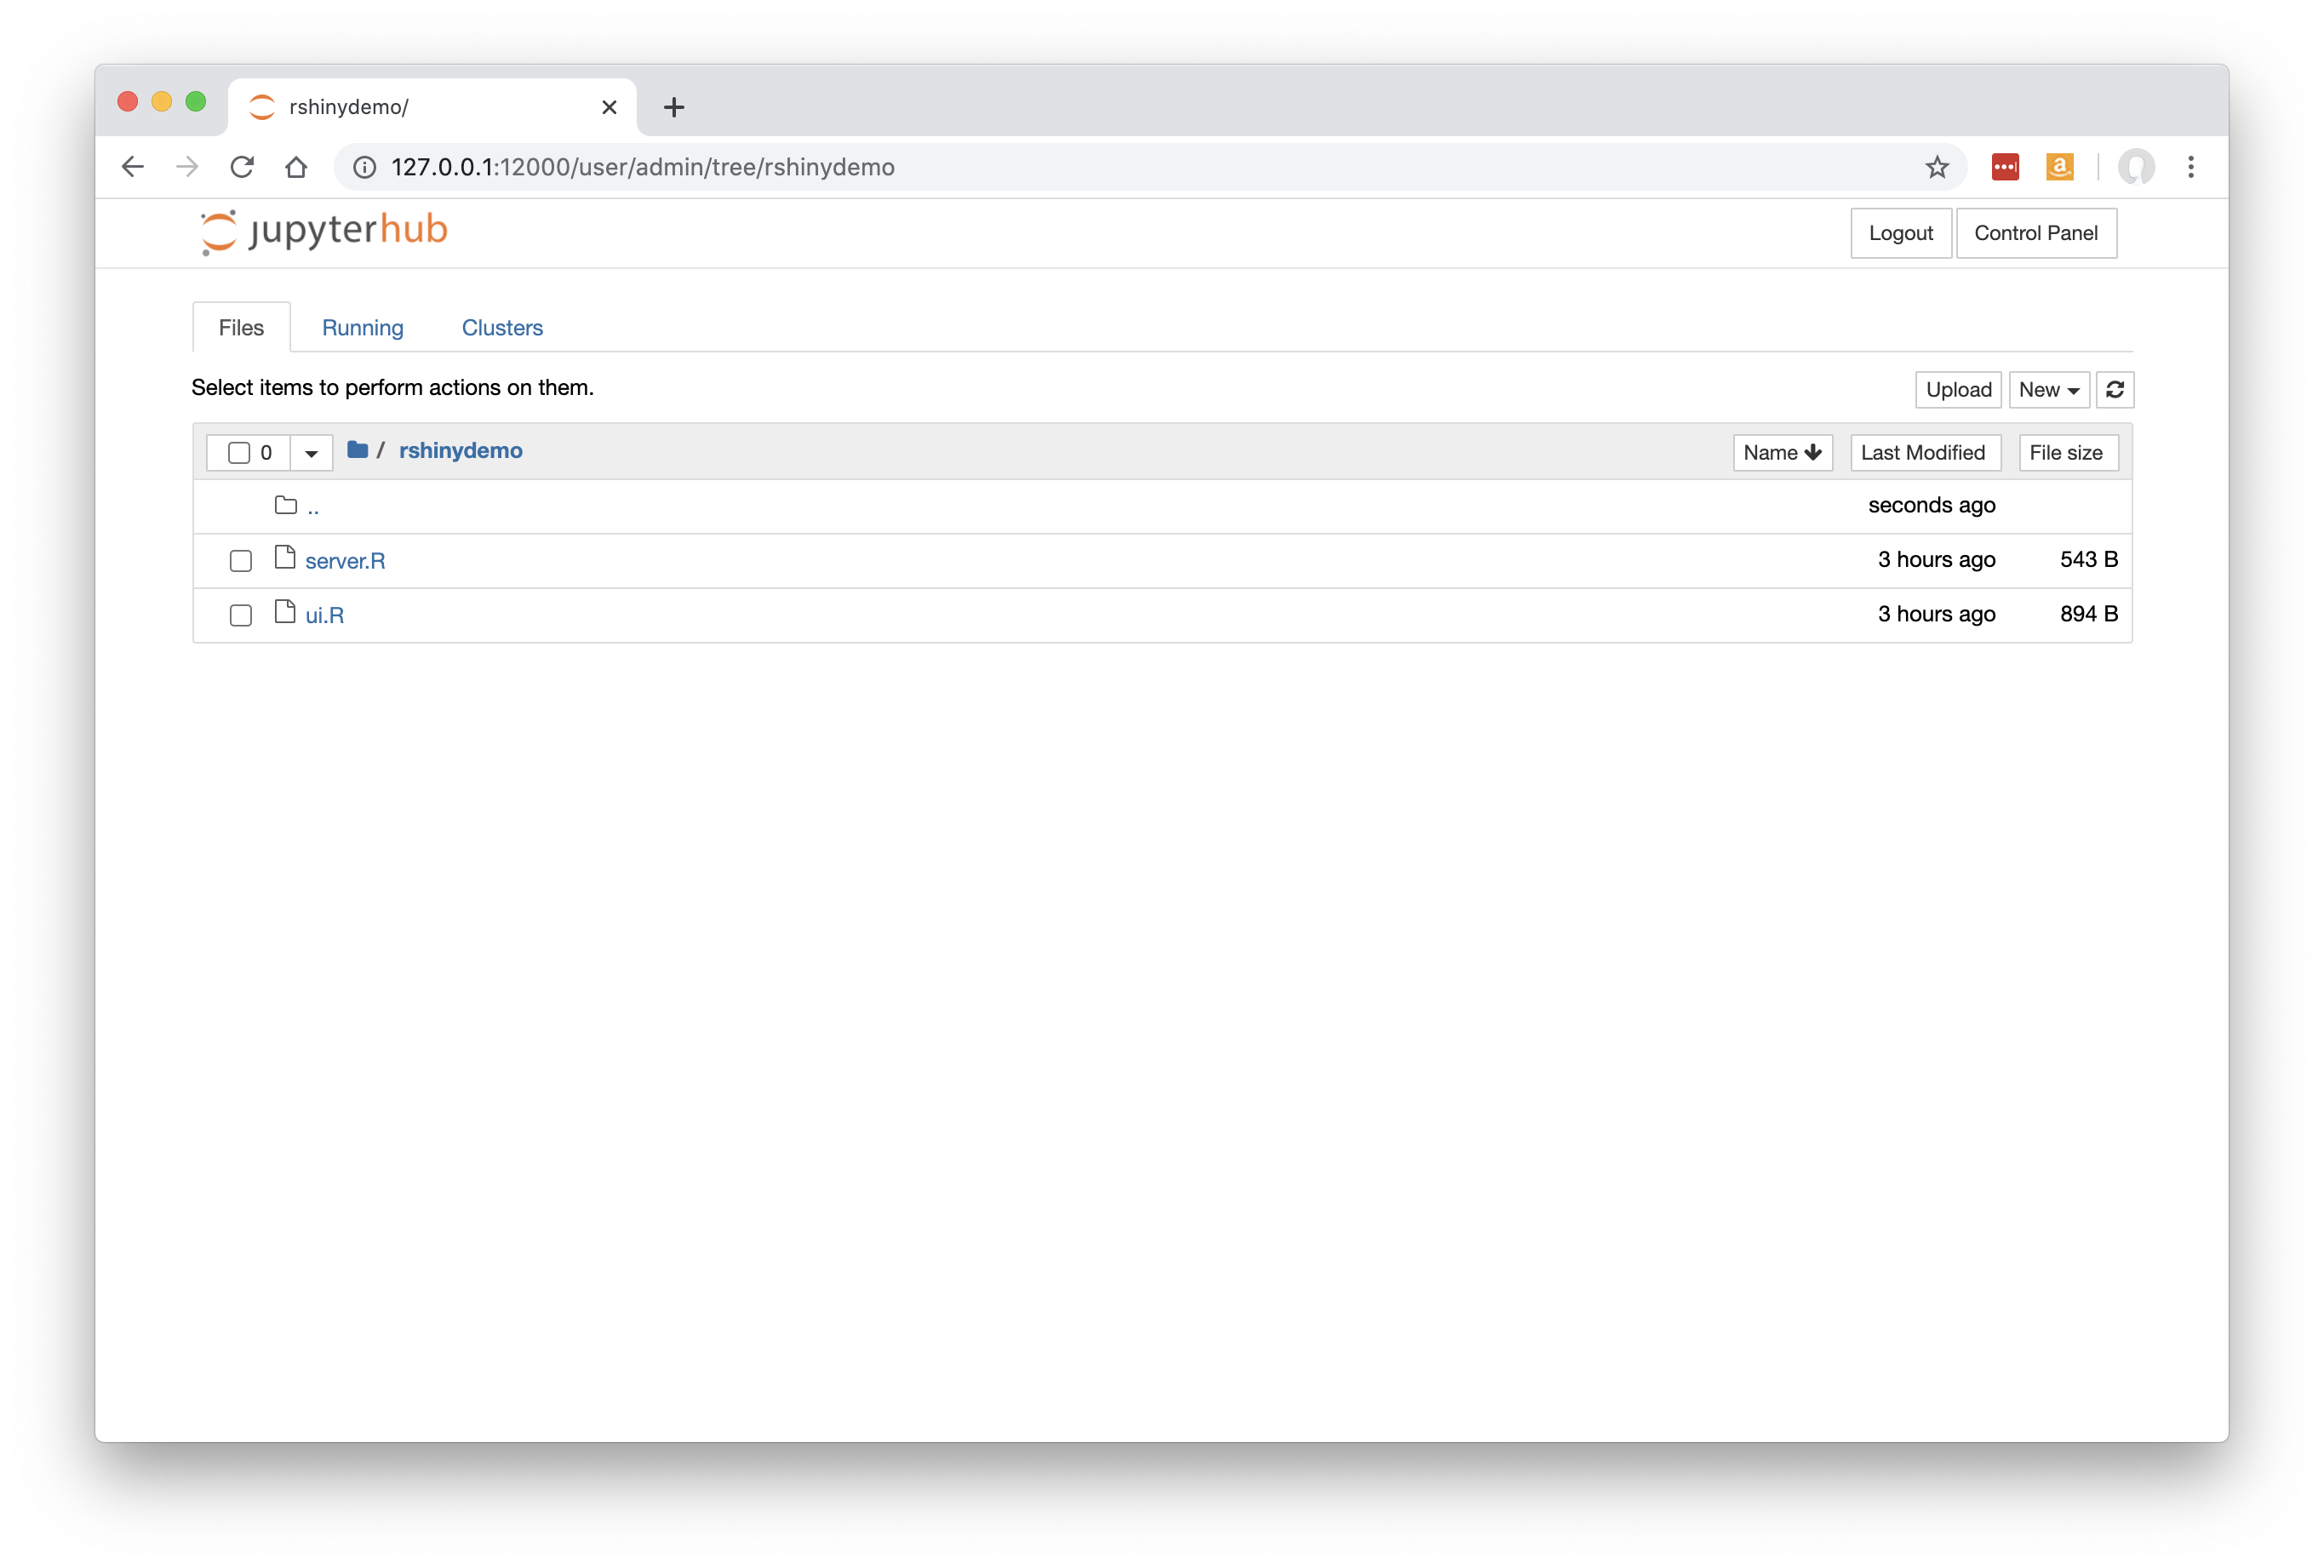
Use ‘My Server’ (or a named server) to upload ui.R and server.R files into a folder along with any data files or other assets required.
Below, we have these two files uploaded to a folder called rshinydemo at the top level of our Jupyter tree. To try out this example, you can obtain the source code here.
For this demo you will need shiny-server installed and available on the PATH.
Click ‘Control Panel’ to go back to JupyterHub.
Please note it is also possible to deploy your app direct from a Git Repo.
New Dashboard
Click ‘Dashboards’ in the menu bar, then click ‘New Dashboard’.
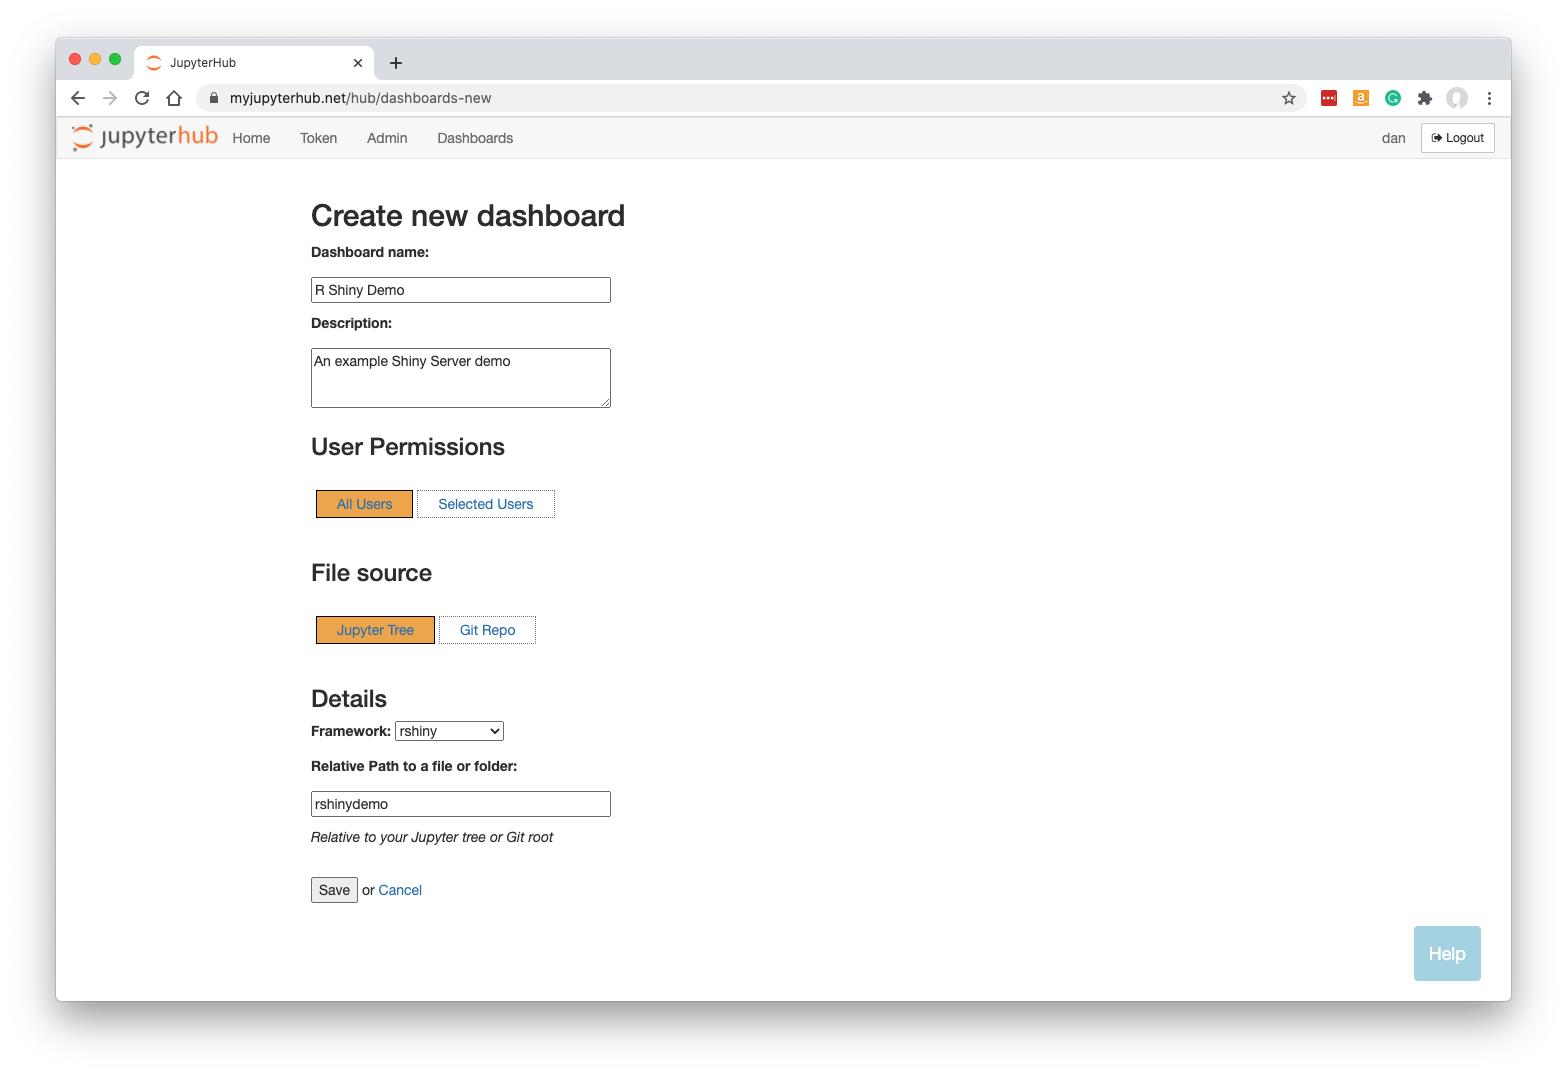
Fill in a name and optionally a description.
Leave ‘Jupyter Tree’ selected.
Select the framework ‘rshiny’ from the dropdown list.
Specify the URL-path to the folder, relative to the Jupyter server’s home folder. In our case, rshinydemo was at the top level in our Jupyter tree, so we just enter rshinydemo.
Note that your Dashboard will be accessible by any other JupyterHub user.
Click ‘Save’.
Building the Dashboard
When you click Save, the dashboard will be built automatically. This just means that a new named server is created based on your new Dashboard, running shiny-server instead of the regular Jupyter server.
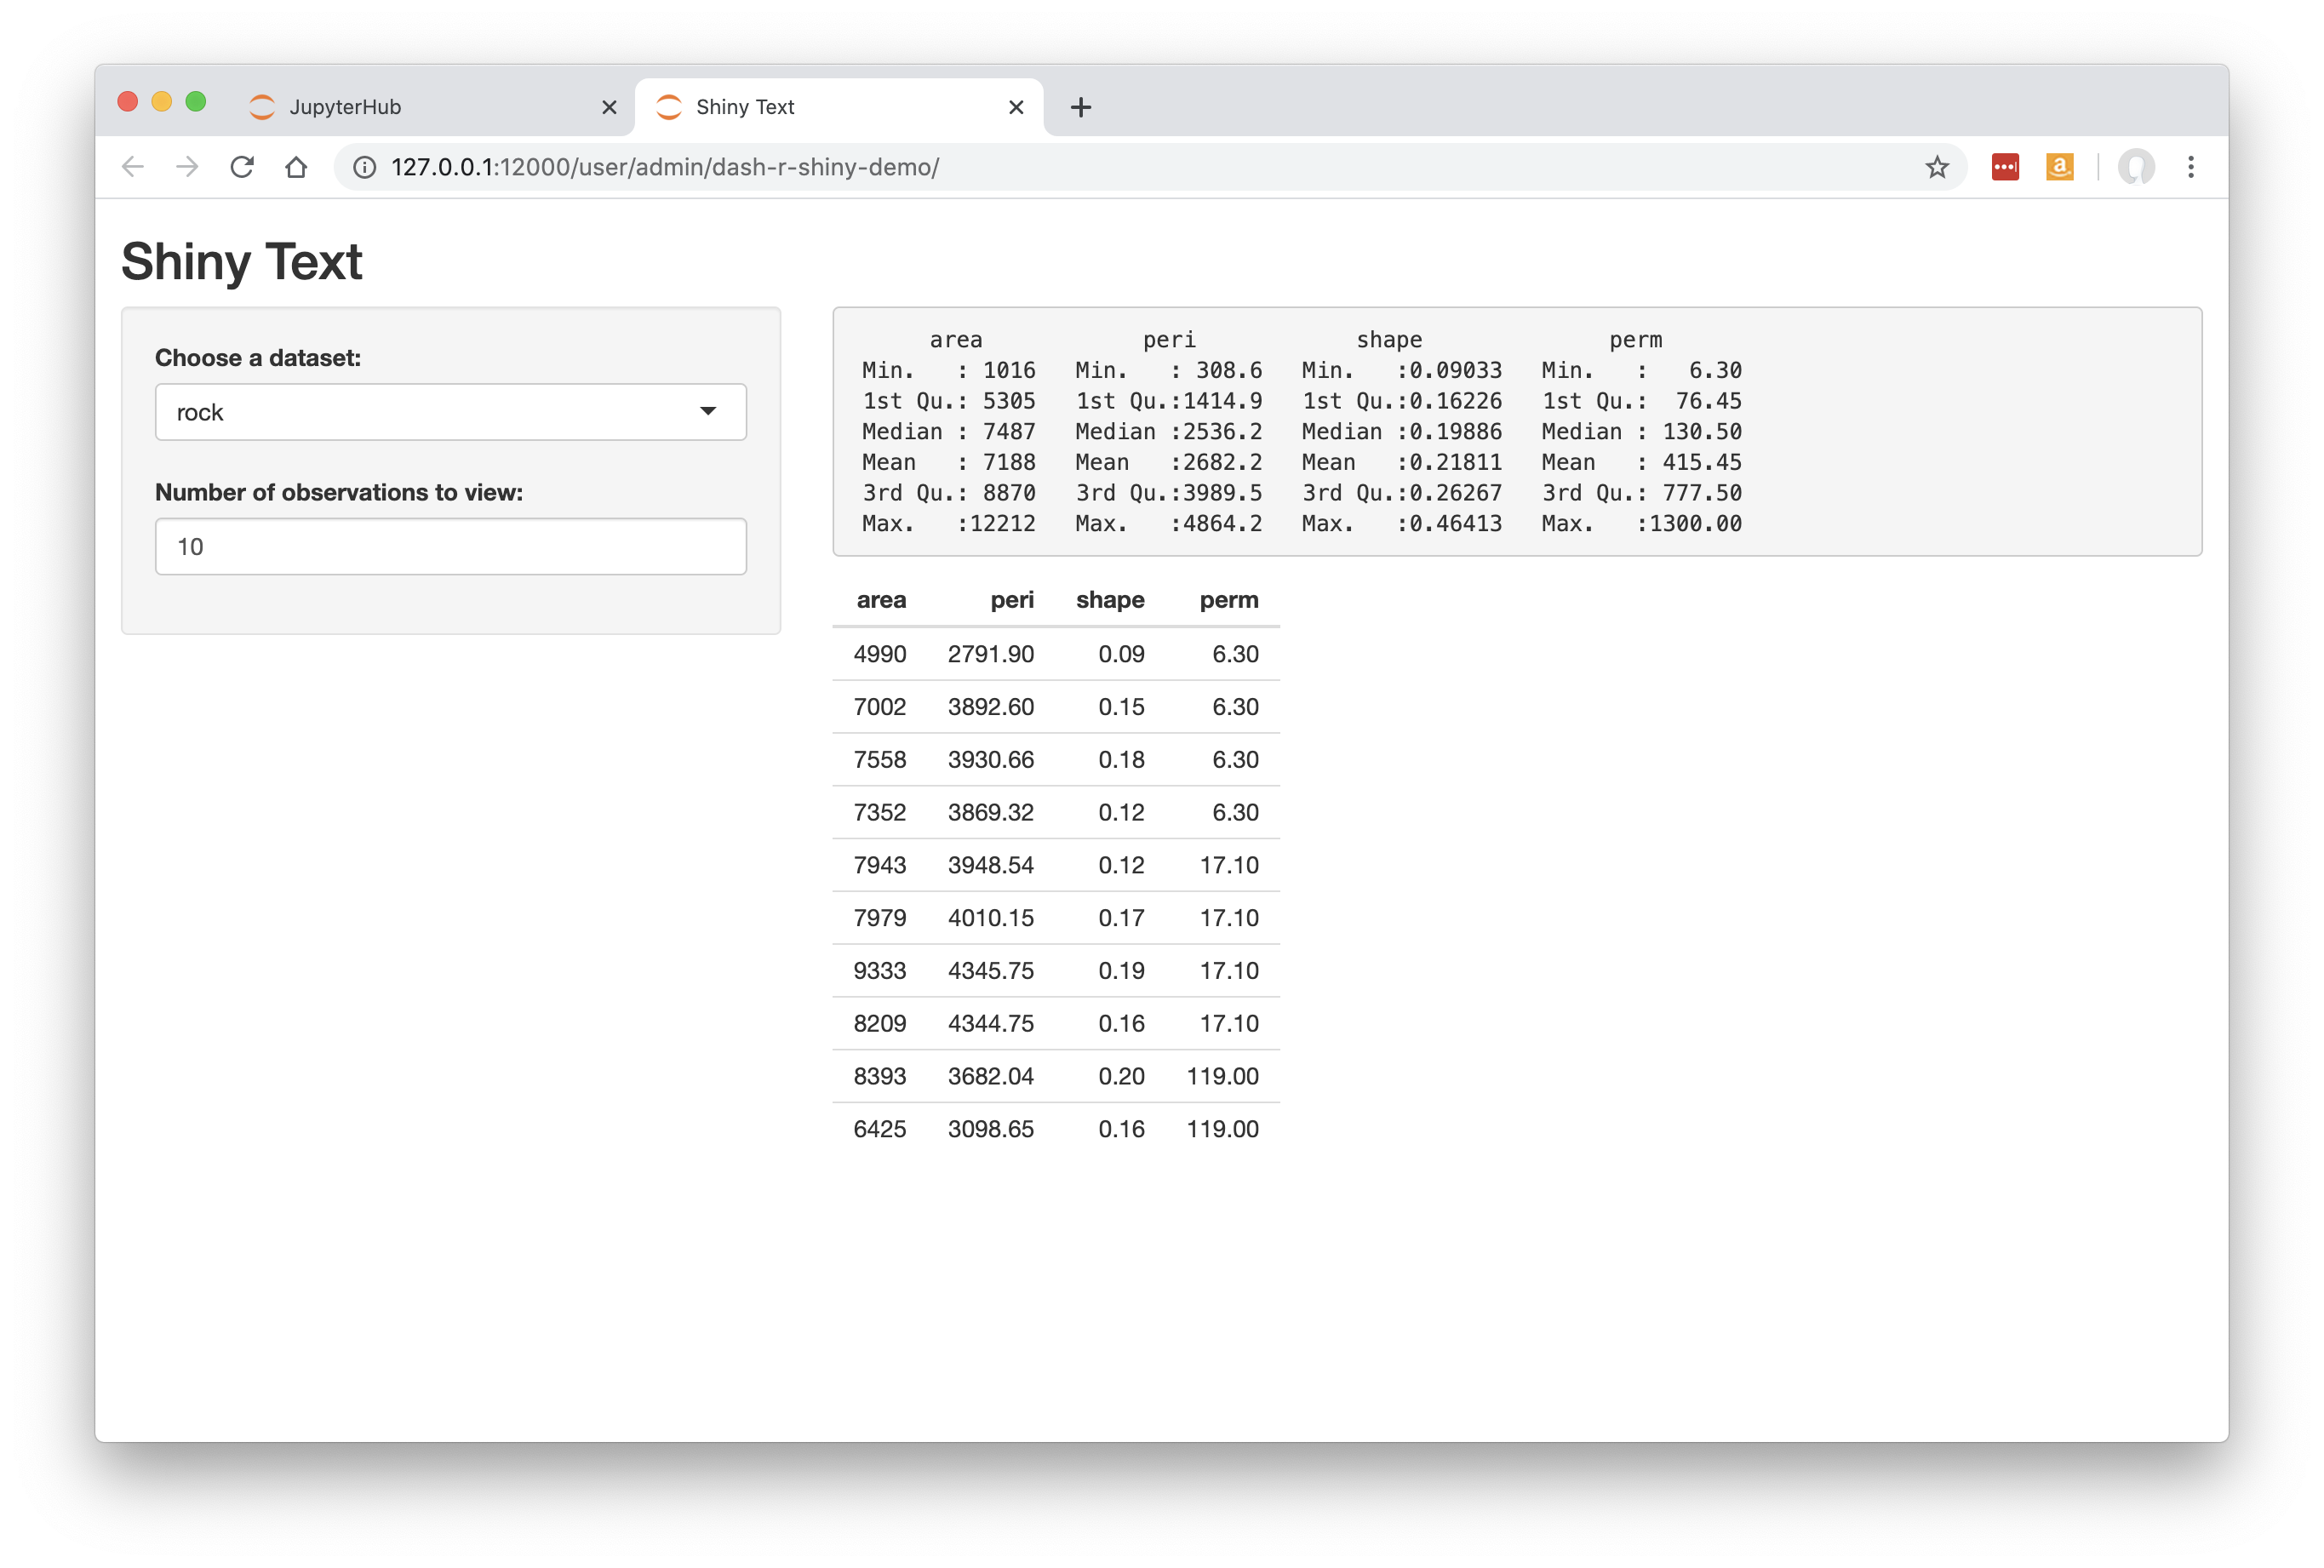
Once the Dashboard is built you will be automatically redirected to it.
The user-friendly and safe version of the app is displayed:
See working with dashboards to understand more about how Dashboards operate, including sharing them with colleagues.