Plotly Dash Apps
How to turn your Plotly Dash app into a Dashboard.
Preparing your Code
In this example, we will source a Plotly Dash app direct from a public GitHub repo.
We have a Dash app in a Python file called plotlyapp.py, along with some files in an assets folder. The source code is here.
It is preferred if your Dash object is called ‘app’ in your script, but if ‘app’ does not exist or is not an object of type dash.Dash, the first suitable dash.Dash object will be located and used.
New Dashboard
Click ‘Dashboards’ in the menu bar. Then click ‘New Dashboard’.
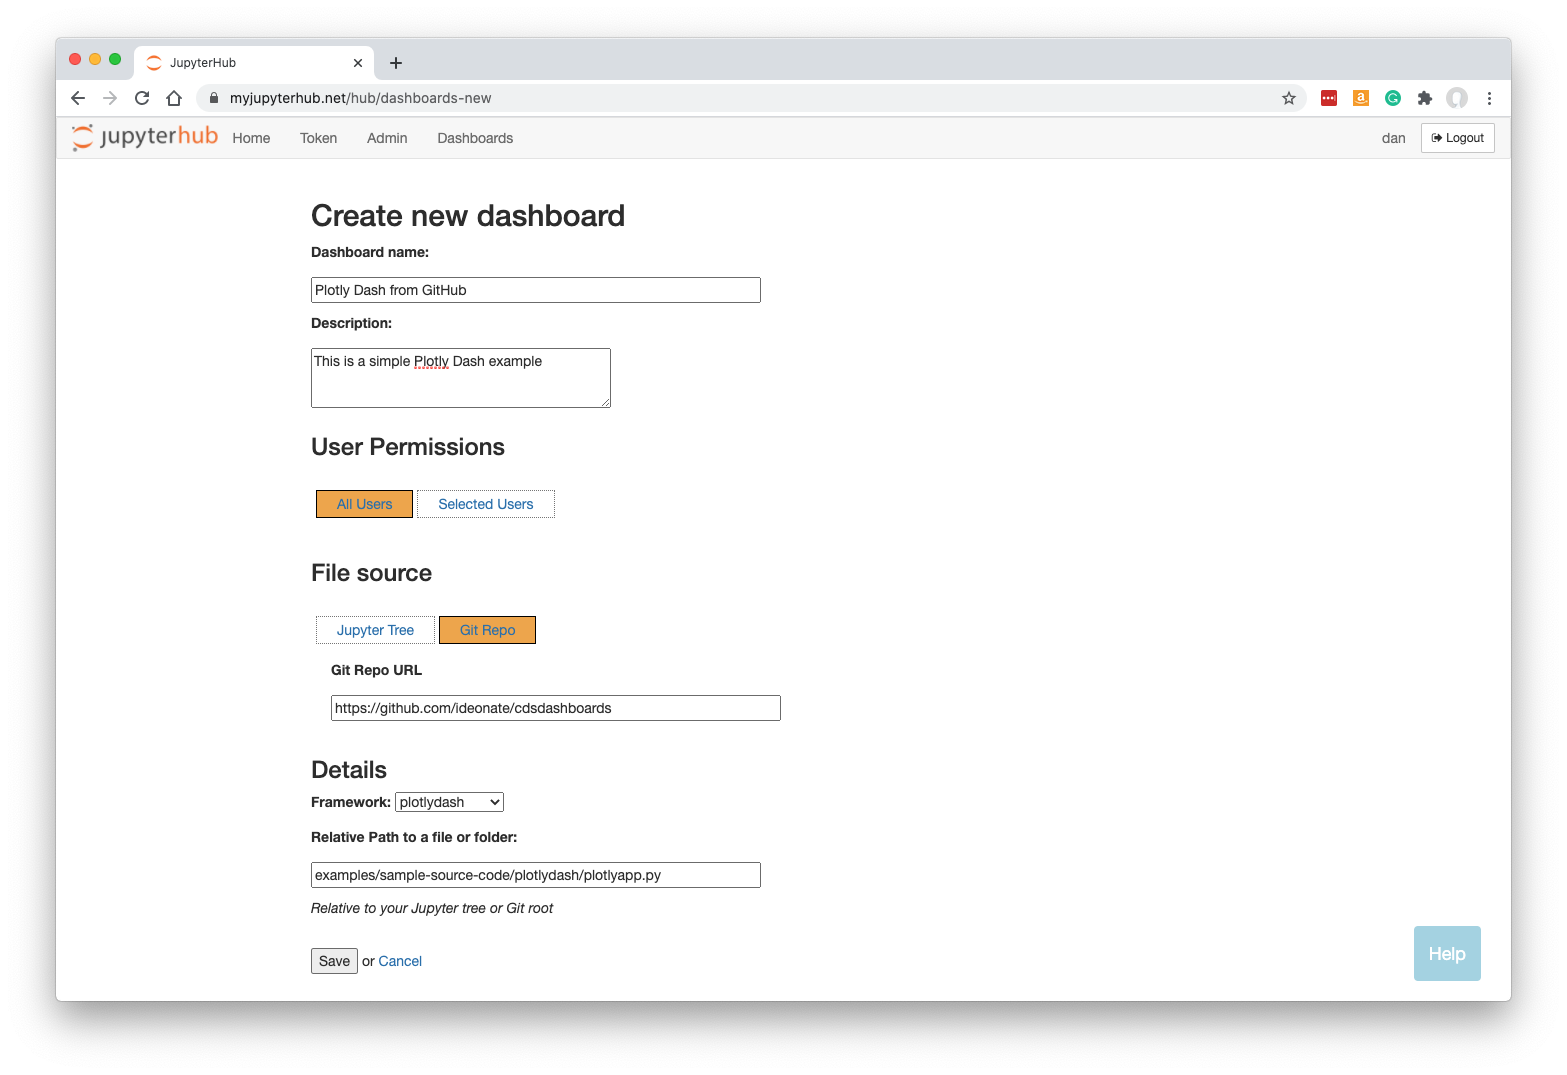
Fill in a name and optionally a description.
Click ‘Git Repo’ and enter the URL: https://github.com/ideonate/cdsdashboards
Select the framework required. For our example, we need to change this to plotlydash.
Specify the URL-path to the Python file of our Dash app, relative to the git repo’s root folder. In our case, plotlyapp.py was three subfolders deep so we enter:
examples/sample-source-code/plotlydash/plotlyapp.py
Note that your Dashboard will be accessible by any other JupyterHub user.
Click ‘Save’.
Building the Dashboard
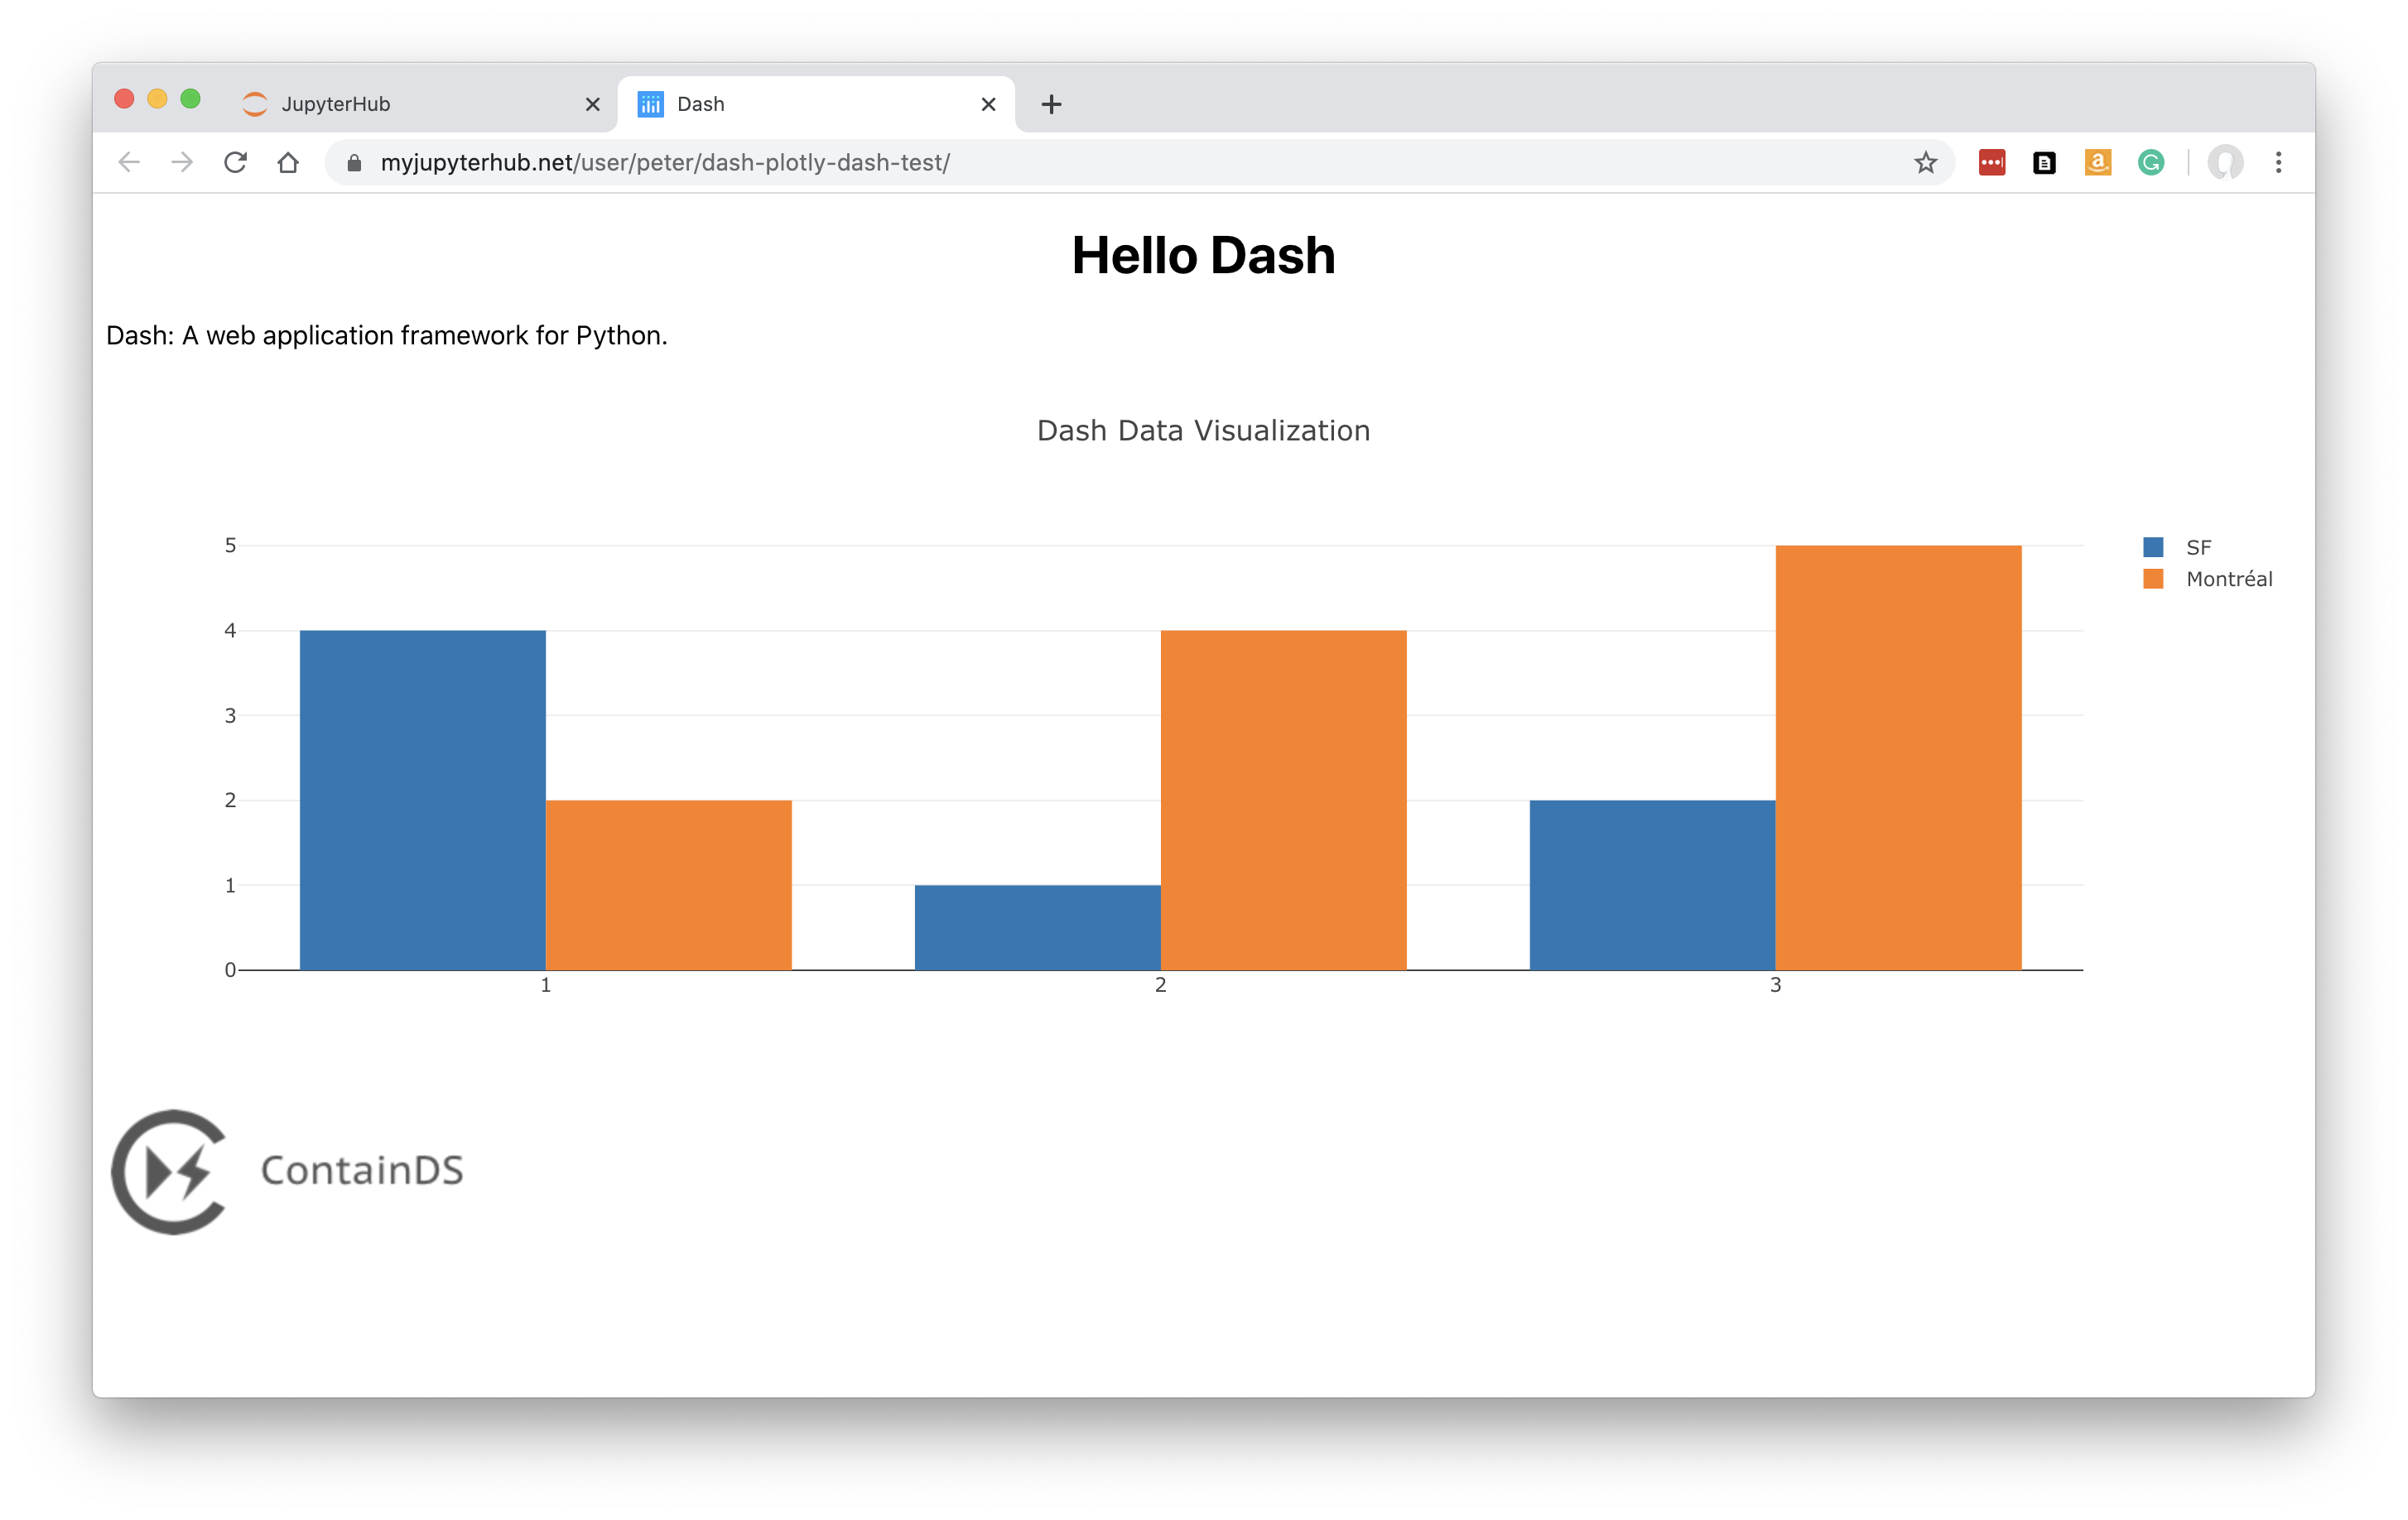
When you click Save, the dashboard will be built automatically. This just means that a new named server is created based on your new Dashboard, running Plotly Dash instead of the regular Jupyter server.
The Plotly Dash app is displayed:
See working with dashboards to understand more about how Dashboards operate, including sharing them with colleagues.